この記事は3年以上前に書かれた記事で内容が古い可能性があります
sympyを使って微分積分した結果をグラフにplotする
sympyを使って微分積分した結果をグラフにplotする
自分が引っかかったところは、numpyとmatplotlibを直接?使わないというところ
sympyで計算して、sympyで描写する
準備
python3.5.0 on Mac環境で進める
まず、必要モジュールをインストール
% pip install sympy
% pip install matplotlib
sympyだけだと、実行時に「ValueError: The TextBackend supports only one graph per Plot.」というエラーが出る
インストールされたモジュールは以下
% pip freeze
cycler==0.10.0
kiwisolver==1.1.0
matplotlib==3.0.3
mpmath==1.1.0
numpy==1.18.1
pyparsing==2.4.6
python-dateutil==2.8.1
six==1.14.0
sympy==1.5.1
このまま実行すると、以下のようなエラーが出てしまう
ImportError: Python is not installed as a framework. The Mac OS X backend will not be able to function correctly if Python is not installed as a framework. See the Python documentation for more information on installing Python as a framework on Mac OS X. Please either reinstall Python as a framework, or try one of the other backends. If you are using (Ana)Conda please install python.app and replace the use of 'python' with 'pythonw'. See 'Working with Matplotlib on OSX' in the Matplotlib FAQ for more information.
「AttributeError: 'NoneType' object has no attribute 'pyplot'」
「matplotlibrc」ファイルの中身を修正することで対応する
参考:Pythonでmatplotlibをimportするとエラーが出る場合の対処策(Mac)
「python -c “import matplotlib;print(matplotlib.matplotlib_fname())”」で表示されたファイルの中身を修正する
% python -c "import matplotlib;print(matplotlib.matplotlib_fname())"
hogehoge/lib/python3.5/site-packages/matplotlib/mpl-data/matplotlibrc
「backend: macosx」部分を「backend: Tkagg」に書き換える
% cp hogehoge/lib/python3.5/site-packages/matplotlib/mpl-data/matplotlibrc hogehoge/lib/python3.5/site-packages/matplotlib/mpl-data/matplotlibrc.20200306

% vim hogehoge/lib/python3.5/site-packages/matplotlib/mpl-data/matplotlibrc

% diff hogehoge/lib/python3.5/site-packages/matplotlib/mpl-data/matplotlibrc hogehoge/lib/python3.5/site-packages/matplotlib/mpl-data/matplotlibrc.20200306
41c41
< backend: Tkagg
---
> backend: macosx
実行
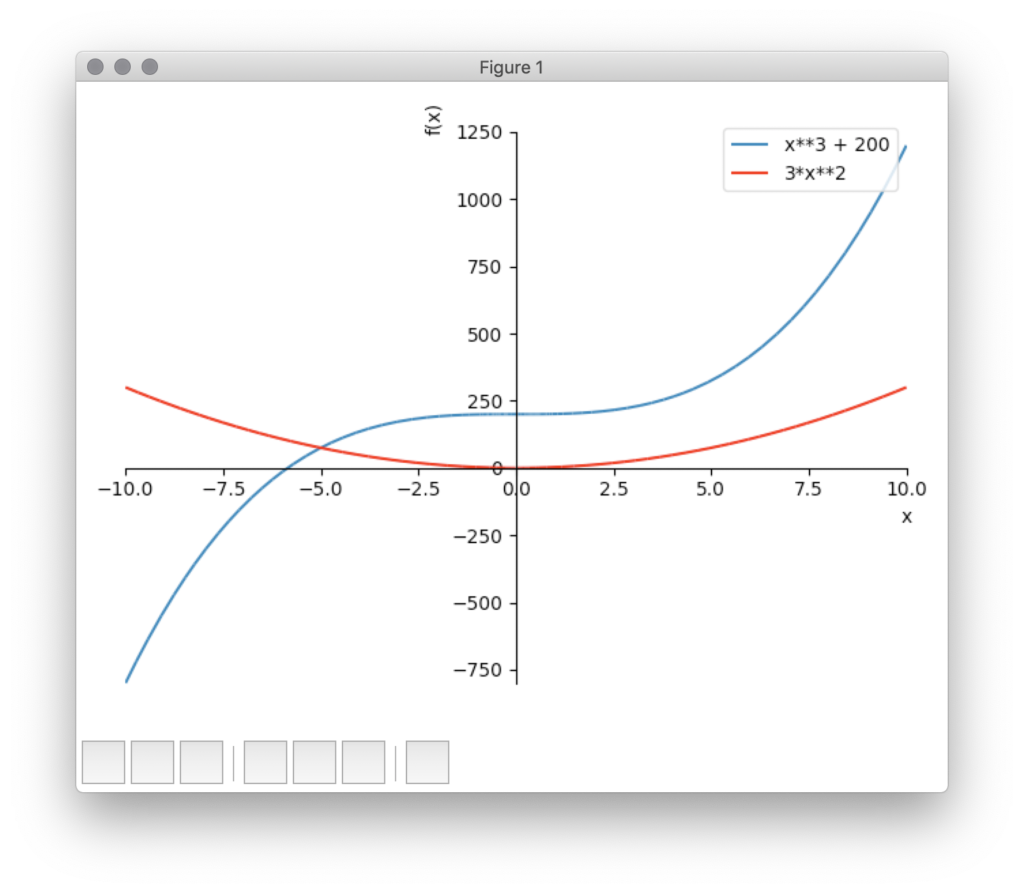
「x **3 + 200」を微分するコードは以下
「diff」関数で微分ができる
「f_org」が微分前で、「f_diff」が微分後
微分後の線は赤に指定する
※「**3」は3乗という意味
% cat bibun_work.py
import sympy as sp

if __name__ == '__main__':
  x = sp.symbols('x')   # 変数定義
  f_org = x **3 + 200   # 微分前
  f_diff = sp.diff(f_org, x)   # 微分後

  p = sp.plot(f_org,f_diff,(x,-10,10), legend = True, show = False)

  p[1].line_color = "red"   # 微分後は赤い線で表示する
  p.show()
いざ実行
% python bibun_work.py
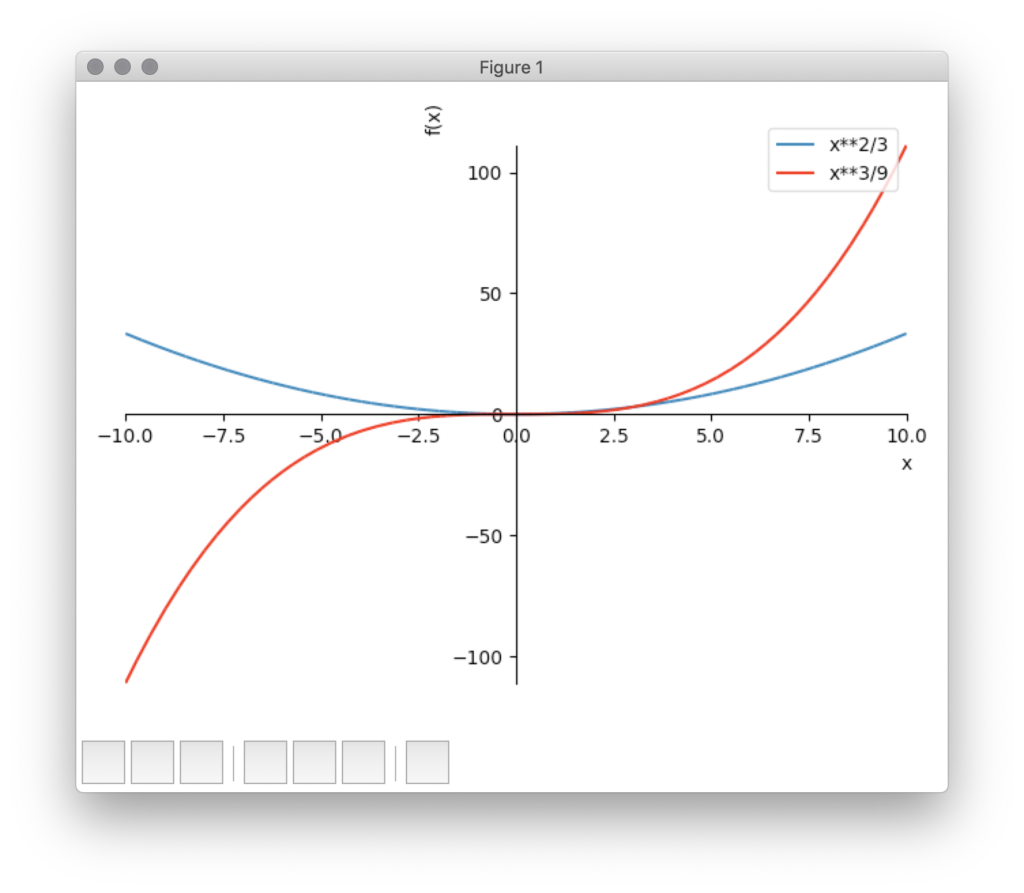
「x**2 / 3」を積分するコードは以下
「integrate」関数で積分ができる
「f_org」が積分前で、「f_inte」が積分後
積分後の線は赤に指定する
% cat bibun_work.py
import sympy as sp

if __name__ == '__main__':
  x = sp.symbols('x')   # 変数定義
  f_org = x**2 / 3   # 積分前
  f_inte = sp.integrate(f_org, x)   # 積分後

  p = sp.plot(f_org,f_inte,(x,-10,10), legend = True, show = False)

  p[1].line_color = "red"   # 積分後は赤い線で表示する
  p.show()
いざ実行
% python bibun_work.py
以上。
参考:
【Python入門】Sympy・matplotlibで微分積分を計算してみよう
[SymPy] Plotting Module